
Generell befolkningsvekst. Vital statistikk Formler for befolkningsstatistikk
Befolkningen i regionen er preget av følgende data, tusen mennesker:
1. I begynnelsen av året:
levde faktisk 1504.6
inkludert midlertidig 7.3
midlertidig fraværende 4.8
2. I løpet av året:
født 7.8
inkludert fast befolkning 7,6
døde 10.2
inkludert innbyggerbefolkning 10.1
ankom permanent opphold 35.6
den faste befolkningen dro til fast opphold i andre bygder 18.6
Definere:
1) den nåværende befolkningen ved slutten av året;
2) størrelsen på den fastboende befolkningen ved begynnelsen og slutten av året;
3) for de permanente befolkningskoeffisienten:
Fruktbarhet, dødelighet, naturlig økning;
Vitalitet, befolkningsomsetning, reproduksjonsøkonomi;
Migrasjon, intensiteten av migrasjonsomsetningen; effektivitet av migrasjon, generell befolkningsvekst.
Løsning:
1) Vi finner dagens populasjon ved årets slutt ved å bruke balanseordningen:
NN K = NN N + N - M + ankom for permanent opphold +
Kom tilbake fra å være midlertidig fraværende -
Den faste befolkningen dro for fast opphold i andre lokaliteter
NN K og NN N - nåværende befolkning ved slutten og begynnelsen av året,
N og M er antall fødsler og dødsfall i dagens befolkning i løpet av året.
NN K = 1504,6 + 7,8 - 10,2 + 35,6 - 18,6 = 1519,2 tusen mennesker.
2) Den permanente befolkningen ved begynnelsen av året vil bli funnet ved hjelp av formelen:
PN N = NN N - VP N + VO N,
PN N, NN N, VP N, VO N - antall fastboende, tilstedeværende, midlertidig bosatte og midlertidig fraværende befolkning ved begynnelsen av året.
PN N = 1504,6 - 7,3 + 4,8 = 1502,1 tusen mennesker.
på slutten av året:
PN K = PN N + N - M + P - V,
N og M - antall fødsler og dødsfall i den fastboende befolkningen i løpet av året;
P og V - antall fastboende som ankom og reiste for permanent opphold i løpet av året.
PN K = 1502,1 + 7,6 - 10,1 + 35,6 - 18,6 = 1516,6 tusen mennesker.
3) For å beregne koeffisientene for naturlig og mekanisk vekst, er det nødvendig å finne gjennomsnittsstørrelsen på den permanente befolkningen.
Etter å ha data om størrelsen på den faste befolkningen ved begynnelsen og slutten av året, bestemmer vi gjennomsnittstallet ved å bruke den enkle aritmetiske gjennomsnittsformelen:
Fødselsraten beregnes ved hjelp av formelen:
Dødeligheten beregnes ved hjelp av formelen:
Den naturlige økningshastigheten kan bestemmes av formelen:
For hver tusen mennesker i den faste befolkningen ble det født 5 barn i løpet av året, ca. 7 personer døde, og den naturlige nedgangen var ca. 2 personer.
La oss bestemme vitalitetskoeffisienten (Pokrovsky-indeksen), som er forholdet mellom antall fødsler og antall dødsfall (per år) i henhold til formelen:
Befolkningens omsetningshastighet beregnes ved hjelp av formelen:

Antall fødsler og dødsfall per 1000 innbyggere i gjennomsnitt per år er 11,73.
Reproduviser andelen naturlig vekst av den totale befolkningsomsetningen.
Koeffisienten for økonomisk reproduksjon av befolkningen er lik:
Følgelig er andelen naturlig nedgang i den totale befolkningsomsetningen i regionen 14 %.
La oss beregne indikatorene for mekanisk bevegelse (migrasjon) av befolkningen.
Mekanisk bevegelse (migrasjon) av befolkningen er ankomst til en gitt lokalitet og avgang fra denne.
Ankomstprisen bestemmes av formelen:
For hver 1000 faste befolkning ankom det i gjennomsnitt omtrent 23 personer per år.
Pensjonssatsen bestemmes av formelen:
Antall personer som reiser for hver 1000 personer i gjennomsnitt per år var omtrent 12 personer.
Vi beregner migrasjonskoeffisienten (mekanisk vekst) på to måter:
Tilstrømningen av befolkning til dette territoriet utgjorde 11 personer for hver 1000 faste befolkning.
Intensitetskoeffisienten for migrasjonsomsetningen beregnes ved å bruke formelen:
Migrberegnes ved å bruke formelen:
Ved å legge til migrasjonskoeffisienten til den naturlige økningsraten får vi samlet befolkningsvekst
som betyr en økning for hver 1000 personer.
ecson.ru
Essensen av migrasjon og migrasjonsvekst
På en forenklet måte er begrepet «migrasjon» dechiffrert som et bostedsskifte (flytting).
Fenomenet migrasjon er et av nøkkelbegrepene i den demografiske prosessen, siden statens funksjon er direkte avhengig av denne handlingen. Migrasjon påvirker befolkningen i en stat, og bestemmer dens økonomiske situasjon.
Begrepet migrasjonsvekst betegnes i demografi som forskjellen mellom de som ankommer et land (region, territorium) for permanent opphold og de som forlater det permanent.
Migrasjonsprosessen er klassifisert etter flere kriterier:
- størrelse;
- form;
- forårsake;
- karakter;
- tidsparameter;
- juridisk status.
Formel for migrasjonsvekst
For å beregne migrasjonsvekst kan det være nødvendig med flere koeffisienter:
- antall personer som ankommer en hvilken som helst region (P);
- antall personer som forlot regionen (B),
- netto (balanse) migrasjon (MS).
Formelen for migrasjonsvekst er forskjellen mellom folk som ankom og de som forlot det tilsvarende territoriet:
MS=P-V.
Migrasjonsvekstformelen kan gi både positive og negative resultater. Hvis den resulterende summen er mindre enn null, kan vi snakke om "migrasjonstap." For å få det motsatte resultatet trenger du et positivt tall.
Mekanisk befolkningsvekst
Det er en annen måte å beregne migrasjonsvekst i tilfellet når den totale og naturlige økningen er kjent. Mekanisk vekst oppnås ved å trekke naturlig vekst fra total vekst.
Relative indikatorverdier kan beregnes for visse befolkningsgrupper. For eksempel er antall besøkende delt på et visst antall lokale innbyggere (ofte i promille). Formelen for migrasjonsvekst i dette tilfellet er som følger:
KP=(P/N)*1000.
KP – ankomstkoeffisient,
P antall besøkende,
N – antall lokale innbyggere.
For å få mer nøyaktige statistiske indikatorer beregnes gjennomsnittsverdier over flere år, noe som gjør det mulig å analysere dagens situasjon, bestemme innvandringspolitikk og administrere arbeidsressurser.
Typer migrasjon
Avhengig av typen migrasjon, vil trekkene ved migrasjonsvekst også variere:
- Episodisk migrasjon (fritidsreiser, turisme, næringsliv) har ingen tidsramme eller retning. Migrasjon er ikke underlagt kontroll og er dårlig studert.
- Pendlingsmigrasjon er forårsaket av befolkningens behov for konstante reiser (for eksempel daglige reiser til jobb eller skole). Denne typen bevegelser har ikke vesentlig innvirkning på migrasjonsveksten, med mindre en person bestemmer seg for å bytte bosted.
- Sesongmessig migrasjon, på grunn av at mangelen på arbeidskraft fylles, blir produksjonsbehovet dekket.
- Irreversibel migrasjon, som omfanget av migrasjonsveksten er mest avhengig av. Det representerer en permanent flytting eller et fullstendig skifte av bolig.
www.solverbook.com
Grunnleggende konsepter:
befolkningsstatistikk; permanent befolkningsstørrelse; gjennomsnittlig befolkning; generell vekst; naturlig vekst; mekanisk gevinst; total vekstrate; fødselsrate; dødelighet; Pokrovsky koeffisient; spedbarnsdødelighet; koeffisient for mekanisk befolkningsvekst; arbeidskapasitetskoeffisient for hele befolkningen; permanent befolkningsstørrelse; arbeidsressurser; yrkesaktiv befolkning.
Befolkningsstatistikk(demografisk statistikk) studerer mønstre av kvantitative endringer i befolkningen. I samsvar med denne hovedoppgaven studerer den: befolkningens størrelse, sammensetning og bevegelse; årsaker og faktorer for befolkningsendringer, migrasjon, fruktbarhet, dødelighet, forventet levealder. Den studerer sammensetningen av befolkningen i henhold til ulike kriterier - kjønn, alder, sosial status, utdanning.
Mål med befolkningsstatistikk:
· studie av antall, beliggenhet, demografisk og sosioøkonomisk sammensetning;
· analyse av reproduksjon og populasjonsdynamikk;
· fastsettelse av den fremtidige størrelsen på hele befolkningen og dens individuelle kontingenter.
Befolkningsstørrelsen bestemmes av staten på et bestemt tidspunkt, dvs. som følge av folketellinger. Folketellingen er for tiden hovedmetoden for nøyaktig å bestemme populasjonsstørrelsen. Folketellinger er imidlertid relativt sjeldne, og befolkningsdata er stadig nødvendig. Derfor gjennomfører statistiske myndigheter i periodene mellom tellingene den såkalte nåværende befolkningsvurderingen, d.v.s. utføre beregninger basert på siste folketellingsdata og gjeldende statistikk over befolkningsbevegelser. Beregningene oppdateres basert på resultatene fra neste folketelling.
Det er to befolkningskategorier tatt i betraktning ved folketellinger: fast bosetting og eksisterende befolkning. TIL fast befolkning inkludere personer som vanligvis bor i en gitt lokalitet, og kontanter– alle personer som var i et gitt territorium i det kritiske øyeblikket av folketellingen, uavhengig av om de oppholder seg her permanent eller midlertidig. For å bestemme størrelsen på den faste befolkningen, tar folketellingsprosessen hensyn til de som er midlertidig fraværende og midlertidig bosatt. Midlertidig fraværende er fastboende på en gitt lokalitet som midlertidig har forlatt den. Dermed er de midlertidig fraværende en del av den faste befolkningen. Midlertidige beboere utgjør en del av dagens befolkning.
Bosatt befolkning kan bestemmes:
hvor er den nåværende befolkningen;
– midlertidig fraværende;
- midlertidige ankomster.
Gjennomsnittlig befolkningsindikator har stor betydning i befolkningsstatistikken. Gjennomsnittlig antall populasjon kan beregnes ved hjelp av ulike metoder. Den mest nøyaktige metoden er antall personår som befolkningen lever. I dette tilfellet blir det totale antallet personår levd av en gitt befolkning i løpet av tidsperioden som studeres, bestemt og delt på lengden av denne perioden. Ofte bestemmes den gjennomsnittlige årlige befolkningen som halvparten av summen av størrelsen ved begynnelsen og slutten av året:
![]() ,
,
 .
.
Befolkningen er den viktigste materielle komponenten i samfunnet, og studiet av mønstrene for dets utvikling er av stor betydning for landets økonomi.
· naturlig bevegelse (fruktbarhet og dødelighet);
· migrasjon (mekanisk) bevegelse.
· folketelling;
· løpende regnskap for befolkningens naturlige bevegelse og dens migrasjon;
· utvalgs- og spesielle demografiske undersøkelser;
· registre og ulike folkeregister.
Hovedkilden til befolkningsdata er folketellingen, som gjennomføres en gang hvert 10. år. I løpet av denne prosessen gjennomføres folketellingen i bosetninger på et bestemt tidspunkt, som kalles det kritiske øyeblikket. I 1853 ble prinsippene for gjennomføring av folketellingen dannet, hvorav de viktigste fortsatt brukes i dag.
Total absolutt befolkningsvekst ():
![]() eller
eller ![]() ,
,
hvor er naturlig vekst;
– mekanisk vekst.
I dette tilfellet: ; ![]() ,
,
hvor er antall fødsler;
– antall dødsfall;
– antall ankomster;
– antall personer som forlater.
Både generell og naturlig, og migrasjonsveksten kan være positiv eller negativ. Absolutte økninger– dette er intervallindikatorer, de beregnes for bestemte tidsperioder (årlige indikatorer er av størst betydning).
Befolkningsdata presenteres på territoriell basis (innenfor administrative-territoriale enheter). Strukturelle indikatorer brukes for å karakterisere fordelingen av befolkningen. Disse er: 1) andelen av befolkningen som bor i visse regioner; 2) en indikator på fysisk befolkningstetthet, som beregnes som forholdet mellom befolkningen og området den okkuperer (den høyeste befolkningstettheten er 15 539 mennesker per 1 km 2 i Monaco).
· liten - med en befolkning på opptil 50 tusen;
· gjennomsnittlig – 50-100 tusen;
· stor – 100-250 tusen;
· stor – 250-1 millioner;
· størst – mer enn 1 million
Ved å studere fruktbarhet, dødelighet og naturlig befolkningsvekst, bestemmer statistikk først og fremst deres absolutte størrelser, dvs. fastslår antall fødsler, antall dødsfall og forskjellen mellom disse tallene, kalt absolutt indikator på naturlig befolkningsvekst. Disse indikatorene beregnes for en viss tidsperiode - et år, en måned, etc.
Fertilitetsrate per 1000 personer:
![]() ,
,
hvor er antall fødsler;
Dødsrate per 1000 personer:
![]() ,
,
Hvor M– antall dødsfall.
Naturlig økningsrate:
![]()
![]() .
.
Befolkningsvitalitetsrate(Pokrovsky):
![]() ,
,
Spedbarnsdødelighet (Raths formel):
 ,
,
hvor – de som døde før 1 års alder;
– født;
Spesifikk fruktbarhetsrate beregnes som forholdet mellom antall fødsler () og gjennomsnittlig antall kvinner i reproduktiv alder (15-49 år):
Total fruktbarhet (n) er lik produktet av den spesielle fruktbarhetsraten og andelen kvinner 15-49 år i hele befolkningen ():
![]() ,
,
Hvor  .
.
Migrasjonsbalanse: ![]()
Total absolutt økning: ![]() .
.
Mekanisk befolkningsvekst:
![]() .
.
Total befolkningsvekst:
![]() eller
eller ![]() .
.
Arbeidsressurser- Dette er den delen av landets befolkning som har nødvendig fysisk utvikling, helse, utdanning, kvalifikasjoner og fagkunnskap for å jobbe i samfunnsøkonomien. Arbeidsstyrkestatistikk studerer følgende kategorier:
· befolkning i arbeidsfør alder;
· yrkesaktiv befolkning i arbeidsfør alder;
· arbeidsressurser.
Arbeidsressurser generelt er potensielle arbeidsressurser. I tillegg til dem er det også eksisterende (fungerende eller brukte) arbeidsressurser. Dette er en del av de totale arbeidsressursene som er sysselsatt i nasjonaløkonomien. Forskjellen mellom potensielle og eksisterende arbeidsressurser karakteriserer den absolutte verdien av ubrukte arbeidsressurser.
Arbeidende befolkning er et sett med mennesker som er i stand til å jobbe på grunn av sin alder og helsestatus. Arbeidsaldersgrenser er fastsatt i arbeidslovgivningen. I republikken Hviterussland anses befolkningen i arbeidsfør alder å være: for menn – 16-59 år; for kvinner – 16-54. Resten av befolkningen regnes som uføre etter alder. Den er delt inn i to spesifikke grupper: befolkningen før arbeidskraftig alder (10-15) og befolkningen etter arbeidsfør alder (menn 60 år og eldre, kvinner 55 år og eldre). Den første av dem er en kilde til kompensasjon for tap og påfyll av arbeidsressurser i fremtiden. Den andre er "pensjonsbyrden" på den yrkesaktive befolkningen.
Ikke hele befolkningen i arbeidsfør alder er i stand til å arbeide. Derfor er den delt inn i den yrkesaktive befolkningen og den ikke-yrkesaktive befolkningen i arbeidsfør alder. Elever og studenter i arbeidsfør alder, de som studerer utenfor jobben ved universiteter og fagskoler, og personer i militærtjeneste deltar ikke i sosial produksjon. I tillegg inkluderer de en del av befolkningen sysselsatt i deres husholdning, barnepass og andre grunner.
· hele befolkningen;
· befolkningen i arbeidsfør alder.
Arbeidsevneraten for hele befolkningen:
 ,
,
– total befolkning.
Arbeidsevnekoeffisient for befolkningen i arbeidsfør alder:
 ,
,
Pensjonsbelastningsfaktor:
 ,
,
Erstatningsrate for arbeidskraft:
 ,
,
Total belastningsfaktor(aldersøkonomi-koeffisient) reflekterer graden av belastning på befolkningen i arbeidsfør alder av befolkningen i alle ikke-yrkesaktive aldre.
![]() eller
eller  .
.
Den sysselsatte befolkningen, i tillegg til den yrkesaktive befolkningen, inkluderer yrkesaktive pensjonister (mennesker i pensjonsalder, men ikke pensjonister; funksjonshemmede i funksjonshemningsgruppene I og II); arbeidende tenåringer under 16 år.
For å karakterisere endringer i antall arbeidsressurser over tid og endringstakt beregnes følgende: absolutt vekst; vekstrate og økning i arbeidsressursene.
· å forlate noen mennesker utover yrkesaktiv alder;
· overgang til uførhet og pensjonering på gunstige vilkår;
· død.
Antall potensielle arbeidsressurser kan fastsettes ved begynnelsen og slutten av året, med hensyn til og uten hensyn til migrasjonsbalansen. Forskjellen mellom antall potensielle ressurser ved begynnelsen og slutten av året representerer absolutt naturlig økning (). For å karakterisere intensiteten av reproduksjon av arbeidsressurser, beregne naturlig økningshastighet ():
 ;
; ![]() ,
,
Naturlig påfyllingskoeffisient:
 ,
,
Naturlig deponeringsgrad:
 ,
,
hvor er naturlig deponering.
Så koeffisienten naturlig økning:
![]()
En indikator som karakteriserer etterspørsel og tilbud av arbeidskraft - ledighetsprosent:
 ,
,
Intensitetsnivå for forventet arbeidsfrigjøring:
 .
.
Den viktigste gruppen av den yrkesaktive befolkningen er dens inndeling i sysselsatte og arbeidsledige.
Arbeidsledighet kan beregnes på to måter:
Testspørsmål til emne nr. 15
1. Hvordan bestemme gjennomsnittlig årlig befolkning?
2. Hvordan finne den absolutte befolkningsveksten over et år?
3. Hvordan bestemme Pokrovsky-koeffisienten?
4. Hvordan bestemme den spesifikke fruktbarhetsraten?
5. Arbeidsressurser, hovedkategorier.
lektsia.com
Befolkningsstatistikk (demografisk statistikk) studerer mønstre av kvantitative endringer i befolkningen. I samsvar med denne hovedoppgaven studerer den: befolkningens størrelse, sammensetning og bevegelse; årsaker og faktorer for befolkningsendringer, migrasjon, fruktbarhet, dødelighet, forventet levealder. Den studerer sammensetningen av befolkningen i henhold til ulike kriterier - kjønn, alder, sosial status, utdanning.
Mål med befolkningsstatistikk:
studie av antall, plassering, demografiske og sosioøkonomiske sammensetning; analyse av reproduksjon og populasjonsdynamikk; fastsettelse av den fremtidige størrelsen på hele befolkningen og dens individuelle kontingenter.
Befolkning er utgangspunktet for beregning av mange indikatorer og er av stor økonomisk og sosial betydning. Kunnskap om det er nødvendig for styring, planlegging av økonomisk og sosial utvikling av landet. Størrelsen på et land bedømmes vanligvis av befolkningen.
Befolkningen er i konstant endring på grunn av fødsels- og dødsrater, samt på grunn av romlig bevegelse av befolkningen.
Befolkningsstørrelsen bestemmes av staten på et bestemt tidspunkt, dvs. som følge av folketellinger. Folketellingen er for tiden hovedmetoden for nøyaktig å bestemme populasjonsstørrelsen. Folketellinger er imidlertid relativt sjeldne, og befolkningsdata er stadig nødvendig. Derfor gjennomfører statistiske myndigheter i periodene mellom tellingene den såkalte nåværende befolkningsvurderingen, d.v.s. gjennomføre beregninger basert på siste folketellingsdata og gjeldende statistikk over befolkningsbevegelser. Beregningene oppdateres basert på resultatene fra neste folketelling.
Det er to befolkningskategorier tatt i betraktning ved folketellinger: fast bosetting og eksisterende befolkning. Den faste befolkningen inkluderer personer som vanligvis bor i en gitt lokalitet, og den nåværende befolkningen inkluderer alle personer som var i et gitt territorium på det kritiske tidspunktet for folketellingen, uavhengig av om de bor her permanent eller midlertidig. For å bestemme størrelsen på den faste befolkningen, tar folketellingsprosessen hensyn til de som er midlertidig fraværende og midlertidig bosatt. Midlertidig fraværende er fastboende på en gitt lokalitet som midlertidig har forlatt den. Dermed er de midlertidig fraværende en del av den faste befolkningen. Midlertidige beboere utgjør en del av dagens befolkning.
Innbyggertallet kan bestemmes:
hvor er den nåværende befolkningen;
– midlertidig fraværende;
- midlertidige ankomster.
Gjennomsnittlig befolkningsindikator har stor betydning i befolkningsstatistikken. Gjennomsnittlig befolkningsstørrelse kan beregnes ved hjelp av ulike metoder. Den mest nøyaktige metoden er antall personår som befolkningen lever. I dette tilfellet blir det totale antallet personår levd av en gitt befolkning i løpet av tidsperioden som studeres, bestemt og delt på lengden av denne perioden. Ofte bestemmes den gjennomsnittlige årlige befolkningen som halve summen av størrelsen ved begynnelsen og slutten av året.
![]() ,
,
hvor er folketallet ved begynnelsen av året;
– befolkning ved utgangen av året.
Hvis data er tilgjengelig for flere datoer som er like med hverandre, kan beregningen gjøres ved å bruke den gjennomsnittlige kronologiske enkle formelen:
 .
.
Hvis tidsavstanden mellom datoene er ulik, utføres beregningen ved å bruke den aritmetiske (kronologiske) vektede gjennomsnittsformelen:
For å beregne befolkningsendringer over tid, beregnes dynamikkindikatorer.
Befolkningen er den viktigste materielle komponenten i samfunnet, og studiet av mønstrene for dets utvikling er av stor betydning for landets økonomi.
For hvert enkelt land kan den totale befolkningen endres på grunn av to faktorer:
naturlig bevegelse (fruktbarhet og dødelighet); migrasjon (mekanisk) bevegelse.
Imidlertid endres ikke bare den totale befolkningsstørrelsen, men også sammensetningen.
For tiden bruker statistikk fire komplementære kilder til befolkningsdata:
folketelling; løpende regnskap for den naturlige bevegelsen til befolkningen og dens migrasjon; utvalg og spesielle demografiske undersøkelser; registre og ulike folkeregister.
Data fra disse kildene brukes til forskjellige formål og kan ikke erstatte hverandre. Imidlertid er det en nær forbindelse mellom dem: hver kilde utfyller eller fortsetter den andre.
Hovedkilden til befolkningsdata er folketellingen, som gjennomføres en gang hvert 10. år. Folketellingen under denne prosessen utføres i befolkede områder på et bestemt tidspunkt, som kalles det kritiske øyeblikket.
Når du karakteriserer populasjonsdynamikk, må to forhold tas i betraktning:
1) du kan sammenligne befolkningen i bare én kategori (enten permanent eller eksisterende);
2) hvis det var administrative-territoriale endringer, bør befolkningsdataene være sammenlignbare i forhold til territoriet.
Total absolutt befolkningsvekst ():
![]() eller
eller ![]() ,
,
hvor er naturlig vekst;
– mekanisk vekst.
Samtidig;
![]() ,
,
hvor er antall fødsler;
– antall dødsfall;
– antall ankomster;
– antall personer som forlater.
Både generell og naturlig, og migrasjonsveksten kan være positiv eller negativ. Absolutte økninger er intervallindikatorer de beregnes for bestemte tidsperioder (årlige indikatorer er av størst betydning).
Befolkningsdata presenteres på territoriell basis (innenfor administrative-territoriale enheter). Strukturelle indikatorer brukes for å karakterisere fordelingen av befolkningen. Disse er: 1) andelen av befolkningen som bor i visse regioner; 2) en indikator på fysisk befolkningstetthet, som beregnes som forholdet mellom befolkningen og området den okkuperer (den høyeste befolkningstettheten er 15 539 mennesker per 1 km2 i Monaco).
Et av hovedkjennetegnene ved befolkningsfordeling er dens inndeling i by og land. I henhold til den aksepterte klassifiseringen er byer delt inn i:
liten - med en befolkning på opptil 50 tusen; gjennomsnitt - 50-100 tusen; stor - 100-250 tusen; stor – 250-1 millioner; den største – mer enn 1 million.
Ved å studere fruktbarhet, dødelighet og naturlig befolkningsvekst, bestemmer statistikk først og fremst deres absolutte størrelser, dvs. etablerer antall fødsler, antall dødsfall og forskjellen mellom disse tallene, kalt den absolutte indikatoren for naturlig befolkningsvekst. Disse indikatorene beregnes for en viss tidsperiode - et år, en måned, etc.
Relative indikatorer for disse mengdene, kalt koeffisienter, beregnes også.
Fødselsrate per 1000 personer:
![]() ,
,
hvor er antall fødsler;
– gjennomsnittlig befolkningsstørrelse.
Dødelighet per 1000 personer:
![]() ,
,
hvor M er antall dødsfall.
Naturlig økningsrate:
![]()
eller lik forskjellen mellom fødselsraten og dødsraten:
![]() .
.
Befolkningsvitalitetskoeffisient (Pokrovsky):
![]() ,
,
viser hvor mange nyfødte det er per avdøde.
Spedbarnsdødelighet (rottererstatning):
 ,
,
hvor – de som døde før 1 års alder;
– født;
– født i året før det nåværende.
Den spesifikke fruktbarhetsraten beregnes som forholdet mellom antall fødsler () og gjennomsnittlig antall kvinner i reproduktiv alder (15-49 år):
Den generelle fruktbarhetsraten (n) er lik produktet av den spesielle fruktbarhetsraten og andelen kvinner 15-49 år i hele befolkningen ():
![]() ,
,
Hvor  .
.
Migrasjonsbalanse: ![]()
Total absolutt økning: ![]() .
.
Mekanisk befolkningsvekst:
 .
.
Total befolkningsvekst:
![]() eller
eller ![]() .
.
Vital statistikk inkluderer ekteskap og skilsmisse. Migrasjonsrater er også beregnet. Det er et skille mellom immigrasjon og emigrasjon. Migrasjonsindikatorer er antall ankomster til en gitt lokalitet, de som reiser og forskjellen mellom dem - balansen i migrasjonen. Balansen kan være positiv (mekanisk befolkningsvekst) og negativ. Intensiteten av migrasjon og emigrasjon, så vel som den relative endringen i antall, bestemmes som forholdet mellom disse indikatorene og gjennomsnittlig befolkning, multiplisert med 1000.
Arbeidsressurser er den delen av landets befolkning som har nødvendig fysisk utvikling, helse, utdanning, kvalifikasjoner og fagkunnskap for å arbeide i samfunnsøkonomien. Arbeidsstyrkestatistikk studerer følgende kategorier:
befolkningen i arbeidsfør alder; befolkningen i arbeidsfør alder i arbeidsfør alder; arbeidsressurser.
Størrelsen på et lands arbeidsstyrke bestemmes først og fremst av størrelsen på befolkningen i arbeidsfør alder.
Arbeidsressurser generelt er potensielle arbeidsressurser. I tillegg til dem er det også eksisterende (fungerende eller brukte) arbeidsressurser. Dette er en del av de totale arbeidsressursene som er sysselsatt i nasjonaløkonomien. Forskjellen mellom potensielle og eksisterende arbeidsressurser karakteriserer den absolutte verdien av ubrukte arbeidsressurser.
For å karakterisere befolkningens aldersstruktur med tanke på arbeidsressursene, beregnes en rekke relative indikatorer for struktur og koordinering. Dette er andelen personer under yrkesaktiv alder, yrkesaktiv alder og over yrkesaktiv alder i den totale befolkningen. Jo høyere andel personer i arbeidsfør alder, desto mer effektiv er befolkningens aldersstruktur når det gjelder arbeidsressurser.
Befolkningen i arbeidsfør alder er et sett mennesker som er i stand til å arbeide på grunn av alder og helse. Arbeidsaldersgrenser er fastsatt i arbeidslovgivningen. I republikken Hviterussland anses befolkningen i arbeidsfør alder å være: for menn – 16-59 år; for kvinner – 16 – 54. Resten av befolkningen regnes som uføre etter alder. Den er delt inn i to spesifikke grupper: befolkningen før arbeidskraftig alder (10-15) og befolkningen etter arbeidsfør alder (menn 60 år og eldre, kvinner 55 år og eldre). Den første av dem er en kilde til kompensasjon for tap og påfyll av arbeidsressurser i fremtiden. Den andre er "pensjonsbyrden" på den yrkesaktive befolkningen.
Ikke hele befolkningen i arbeidsfør alder er i stand til å arbeide. Derfor er den delt inn i den yrkesaktive befolkningen og den ikke-yrkesaktive befolkningen i arbeidsfør alder. Studenter i arbeidsfør alder, studier utenfor jobben ved universiteter og fagskoler, og personer i militærtjeneste deltar ikke i sosial produksjon. I tillegg inkluderer de en del av befolkningen som er engasjert i barnepass og andre grunner i husholdningene deres).
Den andre gruppen omfatter befolkningen i arbeidsfør alder med uføregruppe I og II og personer som mottar pensjon på fortrinnsvise vilkår.
Antall arbeidsressurser bestemmes på et bestemt tidspunkt. Ved beregning av en rekke indikatorer benyttes gjennomsnittlig årlig antall arbeidsressurser, som fastsettes på samme måte som gjennomsnittlig årlig befolkning.
Basert på disse befolkningsgruppene bestemmes to arbeidsevnekoeffisienter:
hele befolkningen; befolkningen i arbeidsfør alder.
Arbeidskapasitet for hele befolkningen:
 ,
,
hvor er befolkningen i arbeidsfør alder i arbeidsfør alder;
- hele befolkningen.
Arbeidsevnekoeffisient for befolkningen i arbeidsfør alder:
 ,
,
hvor er befolkningen i arbeidsfør alder.
Pensjonsbelastningsfaktor:
 ,
,
hvor er befolkningen i pensjonsalder.
Erstatningsrate for arbeidskraft:
 ,
,
hvor er befolkningen i førarbeidsalder.
Den totale belastningskoeffisienten (aldersøkonomi-koeffisienten) gjenspeiler belastningsgraden til befolkningen i arbeidsfør alder av befolkningen i alle ikke-arbeidsaktive aldre:
![]() eller
eller  .
.
I tillegg til den yrkesaktive befolkningen inkluderer den sysselsatte befolkningen yrkesaktive pensjonister (personer i pensjonsalder, men ikke pensjonister; funksjonshemmede i funksjonshemningsgrupper I og II), yrkesaktive tenåringer under 16 år.
For å karakterisere endringer i antall arbeidsressurser over tid og endringshastigheten beregnes absolutt vekst, vekstrate og vekstrate for arbeidsressurser.
Endringen i antall arbeidsressurser fra en dato til en annen i løpet av et år kalles bevegelse av arbeidsressurser. Det er naturlig og mekanisk bevegelse av arbeidsressurser.
Naturlig bevegelse består av påfyll av potensielle arbeidsressurser på grunn av overgangen til den yngre generasjonen til arbeidsfør alder (15-16) og deres tap på grunn av:
noen mennesker går utover arbeidsalderen; overgang til uførhet og pensjon på gunstige vilkår; død.
Ved mekanisk bevegelse skjer påfylling på grunn av immigrasjon, og tap oppstår på grunn av emigrasjon av befolkningen.
Antall potensielle arbeidsressurser kan fastsettes ved begynnelsen og slutten av året, med hensyn til og uten hensyn til migrasjonsbalansen. forskjellen mellom antall potensielle ressurser ved begynnelsen og slutten av året representerer absolutt naturlig økning (). For å karakterisere intensiteten av reproduksjon av arbeidsressurser, beregnes koeffisienten for naturlig økning ():
 ;
; ![]() ,
,
hvor er koeffisienten for naturlig påfylling;
– koeffisient for naturlig avhending;
– gjennomsnittlig årlig antall arbeidsressurser.
Naturlig påfyllingskoeffisient:
 ,
,
hvor er naturlig påfyll.
Naturlig deponeringsgrad:
 ,
,
hvor er naturlig deponering.
Så koeffisienten for naturlig økning:
![]()
En indikator som karakteriserer etterspørselen og tilbudet av arbeidskraft - ledighetsgraden:
 ,
,
hvor er det oppgitte antallet nødvendig arbeidsstyrke;
– gjennomsnittlig antall ansatte i bedriften.
Intensitetsnivå for forventet arbeidsfrigjøring:
 .
.
Arbeidsledighet:
Viktige for republikken Hviterussland og dens regioner er indikatorer som karakteriserer aldersstrukturen til befolkningen når det gjelder arbeidsressurser.
Sikkerhetsspørsmål
Hvordan bestemme gjennomsnittlig årlig befolkning? Hvordan finne absolutt befolkningsvekst over et år? Hvordan bestemme Pokrovsky-koeffisienten? Hvordan bestemme den spesifikke fruktbarhetsraten? Arbeidsressurser, hovedkategorier. Hvordan beregne pensjonsbelastningsforholdet til befolkningen?
www.economy-web.org
Dette er koeffisientene: ankomster og avganger; mobilitet (brutto migrasjon) og mekanisk vekst.
Ankomst- og avgangskoeffisienter presenteres henholdsvis i følgende form:
K n = 1000, K V = 1000,
Gjennomsnittlig årlig befolkning.
Således, i Ukraina i fjor, for hver tusen av befolkningen var det i gjennomsnitt 17,1 ankomster og 19,7 avganger, derfor oversteg intensiteten av avganger intensiteten på ankomster med 1,2 ganger.
Mobilitetskoeffisient(Brutto migrasjon), ‰, vil bli skrevet som følger:
K r = 1000 eller K r = K n +K V.
Ifølge Ukraina data fra samme år K r = 17,1 + 19,7 = 36,8 ‰, det vil si at det var et gjennomsnitt på 36,8 migranter i promille av den gjennomsnittlige årlige befolkningen.
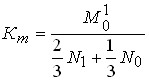
Mekanisk forsterkningskoeffisient populasjonsstørrelse (‰ poeng) karakteriserer dens intensitet og er definert som følger:
K m = eller K m = K n -K i ‰ punkt.
I Ukraina har det det siste året vært en negativ relativ mekanisk befolkningsvekst: K m = - 2,6 ‰, dvs. Intensiteten av nedgangen i befolkningen i Ukraina i løpet av dette året på grunn av migrasjon utgjorde 2,6 ppm.
Spesielle migrasjonsrater ,‰, bestemmes for individuelle kontingenter eller befolkningsgrupper , for eksempel separat for menn og kvinner, for den yrkesaktive befolkningen, samt for de hvis alder overstiger den etablerte grensen for arbeidsevne eller ennå ikke har nådd den, for land- og bybefolkningen.
Delvis migrasjonsrater, ‰, fastsettes separat for hver aldersgruppe av migranter
, , ‰ punkt,
hvor P X, I X- Antall ankomster og avganger for året separat i X-aldersgruppe; - Gjennomsnittlig årlig antall X-aldersgruppe.
Gjennomsnittsalderen for migranter generelt og innenfor kjønn, etter type bosetting og type migrasjon bestemmes også.
Basert på fordeling av migranter på alder, fastsettes den absolutte og relative variasjonen i alderen for ankomster og avganger i løpet av året.
Den siste tiden har strukturen i migrasjonsstrømmene gjennomgått visse endringer. Andelen mellomstatlig migrasjon øker, spesielt blant dem som har forlatt. Volumet av bevegelser mellom naboland øker (andelen ankomster er 94 %, og andelen avganger er 78 % av all mellomstatlig migrasjon), samt ikke-CIS-land, spesielt i avreiseretningen (22 % av mellomstatlig migrasjon). Nå er det objektivt sett flere og flere grunner til fordrivelse, nemlig: retur av tvangsrepatrierte og militært personell til hjemlandet, fremveksten av flyktninger fra krigssteder eller avreise fra miljøforurensede områder. Tid for migrasjon påvirker utviklingen av markedsprosesser - tiltrekke utenlandske investeringer, etablere internasjonale partnerskap og kommersielle bånd. I sin tur påvirker forflytning på den ene siden den demografiske situasjonen i landet, strukturen og volumet på arbeidsmarkedet, og på den annen side kompliserer problemet med sysselsetting av befolkningen, forverrer den sosiale situasjonen og kriminalitetssituasjonen.
Migrasjon- forflytning av mennesker mellom separate territorier knyttet til permanent, midlertidig eller sesongmessig endring av bosted.
Årsaker til migreringer:
- økonomisk;
- politisk;
- nasjonal;
- religiøs.
Folkevandring- den viktigste årsaken til de viktigste endringene som har skjedd i bosettingen av mennesker på jorden de siste århundrene.
Flytting av befolkning over et territorium kalles mekanisk bevegelse av befolkningen eller folkevandring. Samtidig skilles det mellom intern og ekstern (utenfor landets) migrasjon.
Intern migrasjon
Interne migrasjoner inkluderer bevegelse av befolkning fra landsby til by, som i mange land er kilden til byvekst (det kalles ofte "den store folkevandringen på 1900-tallet."). Territoriell omfordeling av befolkningen skjer også mellom store og små byer. Begge disse artene er veldig bredt representert, spesielt i Russland.
Selv om intern migrasjon er typisk for alle stater, er de i ulike land på ulike utviklingsstadier. I utviklingsland haster strømmer av innbyggere på landsbygda som ikke har land og arbeid til byer, og i de mest utviklede landene dominerer «omvendte» migrasjoner av befolkningen (fra byer til forsteder, og delvis til landsbygda).
Ekstern migrasjon
Typer ekstern migrering:- emigrasjon - avreise av statsborgere fra sitt land til et annet for permanent opphold eller mer eller mindre lang sikt
- innvandring er innreise av borgere til et annet land for permanent opphold eller mer eller mindre langvarig opphold.
Eksterne migrasjoner, som oppsto i antikken, fikk sin største utvikling i kapitalismens tid. I land hvor eksterne migrasjoner av befolkningen blir utbredt, kan de ha en betydelig innvirkning på antallet, for eksempel i USA, Canada, Australia, Israel. For tiden har migrasjonsstrømmene i innlandet økt. Samtidig ble det spesielt utbredt. Dette rammet spesielt Vest-Europa, som fra et emigrasjonssenter (som eksisterte i flere århundrer) ble til et attraksjonssenter fra 7 land i Middelhavet og Asia. Viktige sentre for arbeidsinnvandring er USA og oljeproduserende land i Midtøsten.
I andre halvdel av 1900-tallet. En ny form for ekstern migrasjon har dukket opp, kalt "hjerneflukt". Den dukket først opp etter andre verdenskrig, da flere tusen forskere ble eksportert fra Tyskland til USA. I disse dager, sammen med hjerneflukten fra Europa, er det en utvandring fra utviklingsland.
Studie av folkevandring
Analyse av migrasjonsdata viser hvor, fra hvor og i hvilke mengder befolkningsbevegelser i landet skjer.
Befolkningsmigrasjon studeres ved hjelp av absolutte og relative indikatorer.
Absolutte migrasjonsrater
1. Antall ankomster til denne lokaliteten (P)
2. Antall frafall fra denne lokaliteten (B)
3. Mekanisk gevinst populasjon (MP = P - V)
Relative migrasjonsrater
Relative indikatorer inkluderer ankomstrate, avgangsrate og mekanisk økningsrate.
Koeffisientene gitt nedenfor er beregnet i form av produksjon, det vil si per 1000 personer.
Ankomstrate
Viser hvor mange mennesker som i gjennomsnitt ankommer en gitt region per 1000 innbyggere i løpet av et kalenderår:
Utmattelsesrate
Viser hvor mange mennesker som i gjennomsnitt forlot en gitt region per 1000 innbyggere per år:
![]()
Mekanisk forsterkningskoeffisient
Karakteriserer mengden av mekanisk vekst som skjer i gjennomsnitt per 1000 mennesker av regionens befolkning per år, og beregnes på to måter:
I 2000 ankom 350 873 mennesker Russland, og 160 763 mennesker forlot Russland i løpet av samme år.
Migrasjon – flytting av mennesker over grensene til territorier med skifte av bosted permanent eller for en viss tid.
Befolkningens bevegelse i et land kalles intern migrasjon, og bevegelsen av befolkningen fra ett land til et annet - utvendig.
|
Bruttoflytting (bruttoflytting) eller flyttingomsetning |
Viser totalt antall migrerende innbyggere (P + V). |
|
Migrasjonsbalanse eller mekanisk økning |
Forskjellen mellom antall ankomster og avganger: (R – V) |
|
Ankomstrate | |
|
Utmattelsesrate |
|
|
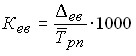
Mekanisk veksthastighet (migrasjonsintensitet) av befolkningen |
|
|
Migrasjonsomsetningsintensitetskoeffisient |
Karakteriserer hyppigheten av tilfeller av skifte av bosted i befolkningen over en viss periode |
|
Migrasjonseffektivitetsforhold |
|
|
Generell befolkningsvekst |
TIL generelt = K spise.pr + K mek.pr |

 eller TIL pels pr = K innkommende
–
-TIL velge
eller TIL pels pr = K innkommende
–
-TIL velge

Typisk problem 2
Den mekaniske bevegelsen av regionens befolkning er preget av følgende data.
Gjennomsnittlig årlig befolkning er 146 900 mennesker.
Ankom denne regionen - 495 personer.
216 mennesker forlot regionen.
Definere:
migrasjonsøkning;
volum av migrasjon;
ankomst rate;
utmattelsesrate;
generell;
migrasjon;
migrasjonseffektivitetsforhold.
Trekk konklusjoner.
Løsning: 1. Migrasjonsøkning = 495 – 216 = 279 personer.
2. Migrasjonsvolum = 495+216=711 personer.
3. Ankomstrate: %o .
4. Avgangsprosent: %o .
5. Generell koeffisient for migrasjonsintensitet:
TIL pels pr = K innkommende – TIL velge= 3,36 – 1,47 = 1,89 %o.
6. Migreringsomsetningskoeffisient:
7. Migrasjonseffektivitetsforhold:
Denne regionen opplever befolkningsvekst på grunn av en positiv migrasjonsbalanse.
Typisk problem 3
Landets befolkning ved begynnelsen av året var 105 599,6 tusen mennesker. I løpet av året ble 1311.604 tusen mennesker født, 2254.856 tusen mennesker døde. 2334.034 tusen mennesker ankom for permanent opphold i landet, 2252.253 tusen mennesker dro. Antall kvinner i alderen 15 til 49 år var 39097.069 tusen mennesker.
Basert på dataene ovenfor, beregn:
1) befolkning ved slutten av året;
2) gjennomsnittlig årlig befolkning;
3) generelle koeffisienter for naturlig og mekanisk bevegelse av befolkningen;
4) Pokrovsky vitalitetskoeffisient;
5) spesiell fruktbarhetskoeffisient (fertilitet) for kvinner;
6) potensiell befolkningsstørrelse om 2 år.
Trekk konklusjoner.
Løsning: 1. Befolkning ved slutten av året:
S k.g = S n.g + N – M + P – V = 105599,6 + 1311.604 – 2254.856 + 2334.034 – 2252.253 = 104738.129 (tusen mennesker)
2. Gjennomsnittlig årlig befolkning:
(tusen mennesker)
3. Generelle odds:
Fertilitetsrate: %O ;
Dødsrate: %O ;
Rate for naturlig økning (tap) av befolkningen:
Ankomstrate: %o;
Utmattelsesrate: %o;
Mekanisk forsterkningskoeffisient:
TIL pels pr = K innkommende - TIL velge= 22,20 – 21,42 = 0,78 %o;
Migrasjonseffektivitetsforhold:
Total vekstrate:
TIL generelt = K spise.pr + K mek.pr= -8,97 + 0,78 = -8,19 %o.
4. Pokrovsky vitalitetskoeffisient:  .
.
5. Spesiell fruktbarhet hos kvinner:
Prospektiv befolkningsstørrelse om 2 år:
(tusen mennesker).
Av dataene som er presentert og innhentet, følger det at landet opplever en naturlig befolkningsnedgang; antall dødsfall overstiger antall fødsler, og migrasjonsprosesser kompenserer ikke for tapet. Prosesser med befolkningsavfolkning observeres, og den lave fruktbarhetsraten for kvinner spiller en stor rolle i dagens situasjon. Etter 2 år vil således den anslåtte befolkningen være mindre enn den faktiske.
Befolkningsstatistikk (demografisk statistikk) studerer mønstre av kvantitative endringer i befolkningen. I samsvar med denne hovedoppgaven studerer den: befolkningens størrelse, sammensetning og bevegelse; årsaker og faktorer for befolkningsendringer, migrasjon, fruktbarhet, dødelighet, forventet levealder. Den studerer sammensetningen av befolkningen i henhold til ulike kriterier - kjønn, alder, sosial status, utdanning.
Mål med befolkningsstatistikk:
studie av antall, plassering, demografiske og sosioøkonomiske sammensetning; analyse av reproduksjon og populasjonsdynamikk; fastsettelse av den fremtidige størrelsen på hele befolkningen og dens individuelle kontingenter.
Befolkning er utgangspunktet for beregning av mange indikatorer og er av stor økonomisk og sosial betydning. Kunnskap om det er nødvendig for styring, planlegging av økonomisk og sosial utvikling av landet. Størrelsen på et land bedømmes vanligvis av befolkningen.
Befolkningen er i konstant endring på grunn av fødsels- og dødsrater, samt på grunn av romlig bevegelse av befolkningen.
Befolkningsstørrelsen bestemmes av staten på et bestemt tidspunkt, dvs. som følge av folketellinger. Folketellingen er for tiden hovedmetoden for nøyaktig å bestemme populasjonsstørrelsen. Folketellinger er imidlertid relativt sjeldne, og befolkningsdata er stadig nødvendig. Derfor gjennomfører statistiske myndigheter i periodene mellom tellingene den såkalte nåværende befolkningsvurderingen, d.v.s. gjennomføre beregninger basert på siste folketellingsdata og gjeldende statistikk over befolkningsbevegelser. Beregningene oppdateres basert på resultatene fra neste folketelling.
Det er to befolkningskategorier tatt i betraktning ved folketellinger: fast bosetting og eksisterende befolkning. Den faste befolkningen inkluderer personer som vanligvis bor i en gitt lokalitet, og den nåværende befolkningen inkluderer alle personer som var i et gitt territorium på det kritiske tidspunktet for folketellingen, uavhengig av om de bor her permanent eller midlertidig. For å bestemme størrelsen på den faste befolkningen, tar folketellingsprosessen hensyn til de som er midlertidig fraværende og midlertidig bosatt. Midlertidig fraværende er fastboende på en gitt lokalitet som midlertidig har forlatt den. Dermed er de midlertidig fraværende en del av den faste befolkningen. Midlertidige beboere utgjør en del av dagens befolkning.
Innbyggertallet kan bestemmes:
hvor er den nåværende befolkningen;
– midlertidig fraværende;
- midlertidige ankomster.
Gjennomsnittlig befolkningsindikator har stor betydning i befolkningsstatistikken. Gjennomsnittlig befolkningsstørrelse kan beregnes ved hjelp av ulike metoder. Den mest nøyaktige metoden er antall personår som befolkningen lever. I dette tilfellet blir det totale antallet personår levd av en gitt befolkning i løpet av tidsperioden som studeres, bestemt og delt på lengden av denne perioden. Ofte bestemmes den gjennomsnittlige årlige befolkningen som halve summen av størrelsen ved begynnelsen og slutten av året.
![]() ,
,
hvor er folketallet ved begynnelsen av året;
– befolkning ved utgangen av året.
Hvis data er tilgjengelig for flere datoer som er like med hverandre, kan beregningen gjøres ved å bruke den gjennomsnittlige kronologiske enkle formelen:
 .
.
Hvis tidsavstanden mellom datoene er ulik, utføres beregningen ved å bruke den aritmetiske (kronologiske) vektede gjennomsnittsformelen:
For å beregne befolkningsendringer over tid, beregnes dynamikkindikatorer.
Befolkningen er den viktigste materielle komponenten i samfunnet, og studiet av mønstrene for dets utvikling er av stor betydning for landets økonomi.
For hvert enkelt land kan den totale befolkningen endres på grunn av to faktorer:
naturlig bevegelse (fruktbarhet og dødelighet); migrasjon (mekanisk) bevegelse.
Imidlertid endres ikke bare den totale befolkningsstørrelsen, men også sammensetningen.
For tiden bruker statistikk fire komplementære kilder til befolkningsdata:
folketelling; løpende regnskap for den naturlige bevegelsen til befolkningen og dens migrasjon; utvalg og spesielle demografiske undersøkelser; registre og ulike folkeregister.
Data fra disse kildene brukes til forskjellige formål og kan ikke erstatte hverandre. Imidlertid er det en nær forbindelse mellom dem: hver kilde utfyller eller fortsetter den andre.
Hovedkilden til befolkningsdata er folketellingen, som gjennomføres en gang hvert 10. år. Folketellingen under denne prosessen utføres i befolkede områder på et bestemt tidspunkt, som kalles det kritiske øyeblikket.
Når du karakteriserer populasjonsdynamikk, må to forhold tas i betraktning:
1) du kan sammenligne befolkningen i bare én kategori (enten permanent eller eksisterende);
2) hvis det var administrative-territoriale endringer, bør befolkningsdataene være sammenlignbare i forhold til territoriet.
Total absolutt befolkningsvekst ():
![]() eller
eller ![]() ,
,
hvor er naturlig vekst;
– mekanisk vekst.
Samtidig;
![]() ,
,
hvor er antall fødsler;
– antall dødsfall;
– antall ankomster;
– antall personer som forlater.
Både generell og naturlig, og migrasjonsveksten kan være positiv eller negativ. Absolutte økninger er intervallindikatorer de beregnes for bestemte tidsperioder (årlige indikatorer er av størst betydning).
Befolkningsdata presenteres på territoriell basis (innenfor administrative-territoriale enheter). Strukturelle indikatorer brukes for å karakterisere fordelingen av befolkningen. Disse er: 1) andelen av befolkningen som bor i visse regioner; 2) en indikator på fysisk befolkningstetthet, som beregnes som forholdet mellom befolkningen og området den okkuperer (den høyeste befolkningstettheten er 15 539 mennesker per 1 km2 i Monaco).
Et av hovedkjennetegnene ved befolkningsfordeling er dens inndeling i by og land. I henhold til den aksepterte klassifiseringen er byer delt inn i:
liten - med en befolkning på opptil 50 tusen; gjennomsnitt - 50-100 tusen; stor - 100-250 tusen; stor – 250-1 millioner; den største – mer enn 1 million.
Ved å studere fruktbarhet, dødelighet og naturlig befolkningsvekst, bestemmer statistikk først og fremst deres absolutte størrelser, dvs. etablerer antall fødsler, antall dødsfall og forskjellen mellom disse tallene, kalt den absolutte indikatoren for naturlig befolkningsvekst. Disse indikatorene beregnes for en viss tidsperiode - et år, en måned, etc.
Relative indikatorer for disse mengdene, kalt koeffisienter, beregnes også.
Fødselsrate per 1000 personer:
![]() ,
,
hvor er antall fødsler;
– gjennomsnittlig befolkningsstørrelse.
Dødelighet per 1000 personer:
![]() ,
,
hvor M er antall dødsfall.
Naturlig økningsrate:
![]()
eller lik forskjellen mellom fødselsraten og dødsraten:
![]() .
.
Befolkningsvitalitetskoeffisient (Pokrovsky):
![]() ,
,
viser hvor mange nyfødte det er per avdøde.
Spedbarnsdødelighet (rottererstatning):
 ,
,
hvor – de som døde før 1 års alder;
– født;
– født i året før det nåværende.
Den spesifikke fruktbarhetsraten beregnes som forholdet mellom antall fødsler () og gjennomsnittlig antall kvinner i reproduktiv alder (15-49 år):
Den generelle fruktbarhetsraten (n) er lik produktet av den spesielle fruktbarhetsraten og andelen kvinner 15-49 år i hele befolkningen ():
![]() ,
,
Hvor  .
.
Migrasjonsbalanse: ![]()
Total absolutt økning: ![]() .
.
Mekanisk befolkningsvekst:
 .
.
Total befolkningsvekst:
![]() eller
eller ![]() .
.
Vital statistikk inkluderer ekteskap og skilsmisse. Migrasjonsrater er også beregnet. Det er et skille mellom immigrasjon og emigrasjon. Migrasjonsindikatorer er antall ankomster til en gitt lokalitet, de som reiser og forskjellen mellom dem - balansen i migrasjonen. Balansen kan være positiv (mekanisk befolkningsvekst) og negativ. Intensiteten av migrasjon og emigrasjon, så vel som den relative endringen i antall, bestemmes som forholdet mellom disse indikatorene og gjennomsnittlig befolkning, multiplisert med 1000.
Arbeidsressurser er den delen av landets befolkning som har nødvendig fysisk utvikling, helse, utdanning, kvalifikasjoner og fagkunnskap for å arbeide i samfunnsøkonomien. Arbeidsstyrkestatistikk studerer følgende kategorier:
befolkningen i arbeidsfør alder; befolkningen i arbeidsfør alder i arbeidsfør alder; arbeidsressurser.
Størrelsen på et lands arbeidsstyrke bestemmes først og fremst av størrelsen på befolkningen i arbeidsfør alder.
Arbeidsressurser generelt er potensielle arbeidsressurser. I tillegg til dem er det også eksisterende (fungerende eller brukte) arbeidsressurser. Dette er en del av de totale arbeidsressursene som er sysselsatt i nasjonaløkonomien. Forskjellen mellom potensielle og eksisterende arbeidsressurser karakteriserer den absolutte verdien av ubrukte arbeidsressurser.
For å karakterisere befolkningens aldersstruktur med tanke på arbeidsressursene, beregnes en rekke relative indikatorer for struktur og koordinering. Dette er andelen personer under yrkesaktiv alder, yrkesaktiv alder og over yrkesaktiv alder i den totale befolkningen. Jo høyere andel personer i arbeidsfør alder, desto mer effektiv er befolkningens aldersstruktur når det gjelder arbeidsressurser.
Befolkningen i arbeidsfør alder er et sett mennesker som er i stand til å arbeide på grunn av alder og helse. Arbeidsaldersgrenser er fastsatt i arbeidslovgivningen. I republikken Hviterussland anses befolkningen i arbeidsfør alder å være: for menn – 16-59 år; for kvinner – 16 – 54. Resten av befolkningen regnes som uføre etter alder. Den er delt inn i to spesifikke grupper: befolkningen før arbeidskraftig alder (10-15) og befolkningen etter arbeidsfør alder (menn 60 år og eldre, kvinner 55 år og eldre). Den første av dem er en kilde til kompensasjon for tap og påfyll av arbeidsressurser i fremtiden. Den andre er "pensjonsbyrden" på den yrkesaktive befolkningen.
Ikke hele befolkningen i arbeidsfør alder er i stand til å arbeide. Derfor er den delt inn i den yrkesaktive befolkningen og den ikke-yrkesaktive befolkningen i arbeidsfør alder. Studenter i arbeidsfør alder, studier utenfor jobben ved universiteter og fagskoler, og personer i militærtjeneste deltar ikke i sosial produksjon. I tillegg inkluderer de en del av befolkningen som er engasjert i barnepass og andre grunner i husholdningene deres).
Den andre gruppen omfatter befolkningen i arbeidsfør alder med uføregruppe I og II og personer som mottar pensjon på fortrinnsvise vilkår.
Antall arbeidsressurser bestemmes på et bestemt tidspunkt. Ved beregning av en rekke indikatorer benyttes gjennomsnittlig årlig antall arbeidsressurser, som fastsettes på samme måte som gjennomsnittlig årlig befolkning.
Basert på disse befolkningsgruppene bestemmes to arbeidsevnekoeffisienter:
hele befolkningen; befolkningen i arbeidsfør alder.
Arbeidskapasitet for hele befolkningen:
 ,
,
hvor er befolkningen i arbeidsfør alder i arbeidsfør alder;
- hele befolkningen.
Arbeidsevnekoeffisient for befolkningen i arbeidsfør alder:
 ,
,
hvor er befolkningen i arbeidsfør alder.
Pensjonsbelastningsfaktor:
 ,
,
hvor er befolkningen i pensjonsalder.
Erstatningsrate for arbeidskraft:
 ,
,
hvor er befolkningen i førarbeidsalder.
Den totale belastningskoeffisienten (aldersøkonomi-koeffisienten) gjenspeiler belastningsgraden til befolkningen i arbeidsfør alder av befolkningen i alle ikke-arbeidsaktive aldre:
![]() eller
eller  .
.
I tillegg til den yrkesaktive befolkningen inkluderer den sysselsatte befolkningen yrkesaktive pensjonister (personer i pensjonsalder, men ikke pensjonister; funksjonshemmede i funksjonshemningsgrupper I og II), yrkesaktive tenåringer under 16 år.
For å karakterisere endringer i antall arbeidsressurser over tid og endringshastigheten beregnes absolutt vekst, vekstrate og vekstrate for arbeidsressurser.
Endringen i antall arbeidsressurser fra en dato til en annen i løpet av et år kalles bevegelse av arbeidsressurser. Det er naturlig og mekanisk bevegelse av arbeidsressurser.
Naturlig bevegelse består av påfyll av potensielle arbeidsressurser på grunn av overgangen til den yngre generasjonen til arbeidsfør alder (15-16) og deres tap på grunn av:
noen mennesker går utover arbeidsalderen; overgang til uførhet og pensjon på gunstige vilkår; død.
Ved mekanisk bevegelse skjer påfylling på grunn av immigrasjon, og tap oppstår på grunn av emigrasjon av befolkningen.
Antall potensielle arbeidsressurser kan fastsettes ved begynnelsen og slutten av året, med hensyn til og uten hensyn til migrasjonsbalansen. forskjellen mellom antall potensielle ressurser ved begynnelsen og slutten av året representerer absolutt naturlig økning (). For å karakterisere intensiteten av reproduksjon av arbeidsressurser, beregnes koeffisienten for naturlig økning ():
 ;
; ![]() ,
,
hvor er koeffisienten for naturlig påfylling;
– koeffisient for naturlig avhending;
– gjennomsnittlig årlig antall arbeidsressurser.
Naturlig påfyllingskoeffisient:
 ,
,
hvor er naturlig påfyll.
Naturlig deponeringsgrad:
 ,
,
hvor er naturlig deponering.
Så koeffisienten for naturlig økning:
![]()
En indikator som karakteriserer etterspørselen og tilbudet av arbeidskraft - ledighetsgraden:
 ,
,
hvor er det oppgitte antallet nødvendig arbeidsstyrke;
– gjennomsnittlig antall ansatte i bedriften.
Intensitetsnivå for forventet arbeidsfrigjøring:
 .
.
Arbeidsledighet:
Viktige for republikken Hviterussland og dens regioner er indikatorer som karakteriserer aldersstrukturen til befolkningen når det gjelder arbeidsressurser.
Sikkerhetsspørsmål
Hvordan bestemme gjennomsnittlig årlig befolkning? Hvordan finne absolutt befolkningsvekst over et år? Hvordan bestemme Pokrovsky-koeffisienten? Hvordan bestemme den spesifikke fruktbarhetsraten? Arbeidsressurser, hovedkategorier. Hvordan beregne pensjonsbelastningsforholdet til befolkningen?