
Internal rate of return IRR. Formula and calculation example
The IRR calculation formula is used to analyze the relative profitability of investment projects. IRR allows you not only to compare projects in terms of profitability, but also other assets on the market.
The economic meaning of the internal rate of return
IRR is also called internal rate of return or IRR. The need for an indicator that would assess not the absolute value of income, but the relative is understandable - it is very convenient to take this value and compare it with all possible rates on the market, be it the yield of bonds, deposits, or the cost of loans. Seeing how much the rates of return on assets are higher or lower than the rates for the project, it is easy to make a decision on investments of own funds. At the same time, comparing the profitability and the cost of funding, it is also easy to make a decision to launch a project with borrowed funds if the rate of return significantly exceeds the cost of the loan.
Thus, the formula for calculating the IRR solves the need to estimate the maximum cost of capital at which the project remains effective, that is, the threshold rate from which it goes into negative territory. This rate should nullify the net present value NPV .
In practice, this indicator is called the project's margin of safety, since the gap between IRR and the cost of capital shows how high the loan rate (or other type of funding) the project can withstand. If the value of the project indicator is greater than the cost of capital for the company (ie WACC), then it should be accepted.
IRR calculation formula
Graphical determination method
Picture 1
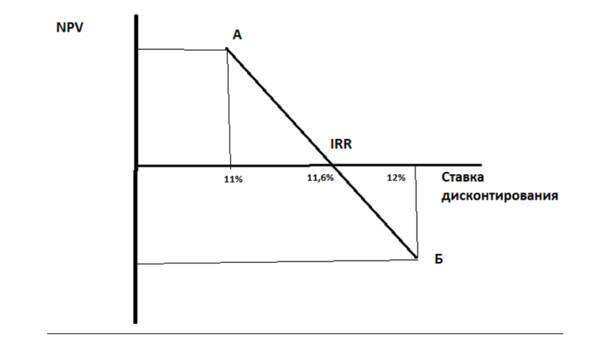
We construct a coordinate system (Fig. 1), where the value of the function is NPV on the ordinate, and discount rates on the abscissa. We select two discount rates so that at one rate (at point "A") the NPV value is positive, at the other - at point "B" - negative, while the closer the value of NPV approaches zero from below and from above, the more accurate the solution will be. Let's connect two points on the chart with a segment - the point of intersection of the segment with the abscissa axis is the rate of the internal rate of return. In our example, if at point "A" the discount rate is 11%, and at "B" - 12%, then at the point of intersection of the abscissa the rate is approximately (by eye) equal to 11.6%. This is not an accurate method, but it gives an idea of the value of the internal rate of return.
Calculation method
A more accurate solution is given by the formula for calculating IRR:
IRR = r1 + NPV1 x (r2 - r1) / (NPV1 - NPV2),
where r1 is the discount rate determined by the fitting method, which corresponds to the positive calculated value of NPV1,
r2 is the fitting discount rate that corresponds to a negative computed NPV2.
In our example, r1 = 11%, r2 = 12%. Suppose NPV1 = 120, NPV2 = -90, then:
IRR = 11% + 120 x (12% -11%) / (120- (-90)) = 0.11 + 120 x (0.01) / 210 = 0.11 + 0.0057 = 0.1157 or 11.57%.
IRR calculation problems and their solution
The IRR calculation formula has drawbacks to consider. Thus, the indicator does not exist if the sign of the NPV value does not change. This means that if the project immediately makes a profit, without going into a minus in the investment phase, then such a project will not have IRR. The situation is rare, but quite likely, for example, if the calculation interval is chosen - a year, and negative cash flow occurs only in the first months, and at the end of the year the project is in positive territory. On the graphical illustration of the calculation, we will see that the trajectory of NPV changes never crosses the abscissa at any value of the discount rate.
Food for one moment. The indicator calculated according to our formula can take fantastically large values. This option is also possible, for example, if the size of the initial investment is not large, and NPV is growing rapidly.
It is possible that there are several IRR values, this is a situation when the business model leads to multiple zero crossings (sign changes) by the NPV indicator in different periods of time, for example, if the project is a milestone and requires large injections exceeding the funds accumulated during the project implementation. In this case, the internal rate of return is meaningless.
The main drawback is that the formula assumes in its construction that positive cash flows are reinvested in the project at the rate of internal rate of return 0
You can solve the problem using the modified IRR (modified internal rate of return, MIRR) formula:
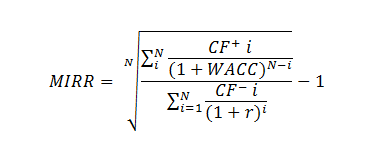
Where CF + - incoming cash flows of the project of the i-th period,
CF - - outgoing cash flows of the project of the i-th period,
WACC - weighted average cost of capital (normative rate of return),
N is the duration of the project.
Outflows are discounted at the price of the project's source of funding. An increase is applied to cash inflows - the value of the flow is brought to the moment of completion of the project. The accrual is carried out at an interest rate equal to the level of reinvestment.
MIRR solves both the problem of multiple IRRs and inadequate estimation of reinvested flows.
The built-in MS Excel toolkit includes the MIRR () function for calculating MIRR.
If the MIRR is greater than the discount rate - r, the project is efficient and must be implemented.
There is often a mistake in calculating IRR if a monthly cash flow breakdown is used. In this case, the use of the rate obtained using the IRR () function as the IRR of the project is incorrect. It is also a mistake to multiply the received IRR rate by the number of months in a year - 12 * IRR months. The monthly calculation must be correctly brought to the annual equivalent - the compound interest formula must be applied to the IRR calculated using the built-in Excel toolkit, then we will see its correct value. The correct formula for monthly broken down cash flows is (1 + IRR months) 12 -1,
where IRR month is calculated by Excel. For a quarterly breakdown, respectively (1 + IRR qt) 4 -1.
In general, comparing IRR with WACC, we get dependencies:
IRR is more than WACC - the project is worth accepting and funding;
IRR less than WACC - the project will bring losses and should be abandoned;
IRR is equal to WACC - revision of the project or change of key parameters is required.
Summary
IRR is a relative indicator of the project's efficiency, the main task of which is to provide management with an estimate of the maximum cost of the project's funding sources, at which it is not unprofitable.
The indicator can give inadequate and contradictory estimates (extremely high values, no IRR in the absence of negative values of the project's cash flow, multiplicity of IRR) and in this case it should be modernized or interpreted correctly.
You should not use IRR as an independent and only indicator of investment performance. However, it belongs to the list of indicators "must have" in investment analysis - for all analysts, CFOs and managers.